
Sportradar USA uses AI to analyze 98 goals from European football and identifies the league that most excites fans.

Sportradar, a global leader in sports data and technology, analyzed over 98 goals scored in Europe's top five leagues over the past 20 years to discover which one delivers the most excitement to fans, and the answer is surprising: it's not the Premier League.
The company used the average number of goals per game as a criterion to measure the level of excitement in matches and, to do so, analyzed more than 36 matches played in England, France, Germany, Italy, and Spain between the 2005/06 and 2024/25 seasons. With more than two decades of experience, Sportradar collaborates with the biggest names in world football and more than 100 sports organizations — including FIFA, UEFA, AFC, and CONMEBOL — with exclusive access to data and responsible for the largest distribution of football content in the industry.
Even with the highest average number of goals in a season in the last 20 years — 3,28 in 2023/24 — the Premier League doesn't lead in excitement. According to an AI-powered analysis by Sportradar, that title belongs to the Bundesliga in Germany.
Since the 2005/06 season, more than 18 goals have been scored in the Bundesliga, even though the 18-team league has played between 1.000 and 1.500 fewer matches than the other major European leagues during the same period.
As a result, German league fans watched an average of 2,96 goals per game over those two decades — a higher number than the averages recorded in the Premier League (2,74), Serie A (2,68), La Liga (2,66) and Ligue 1 (2,53).
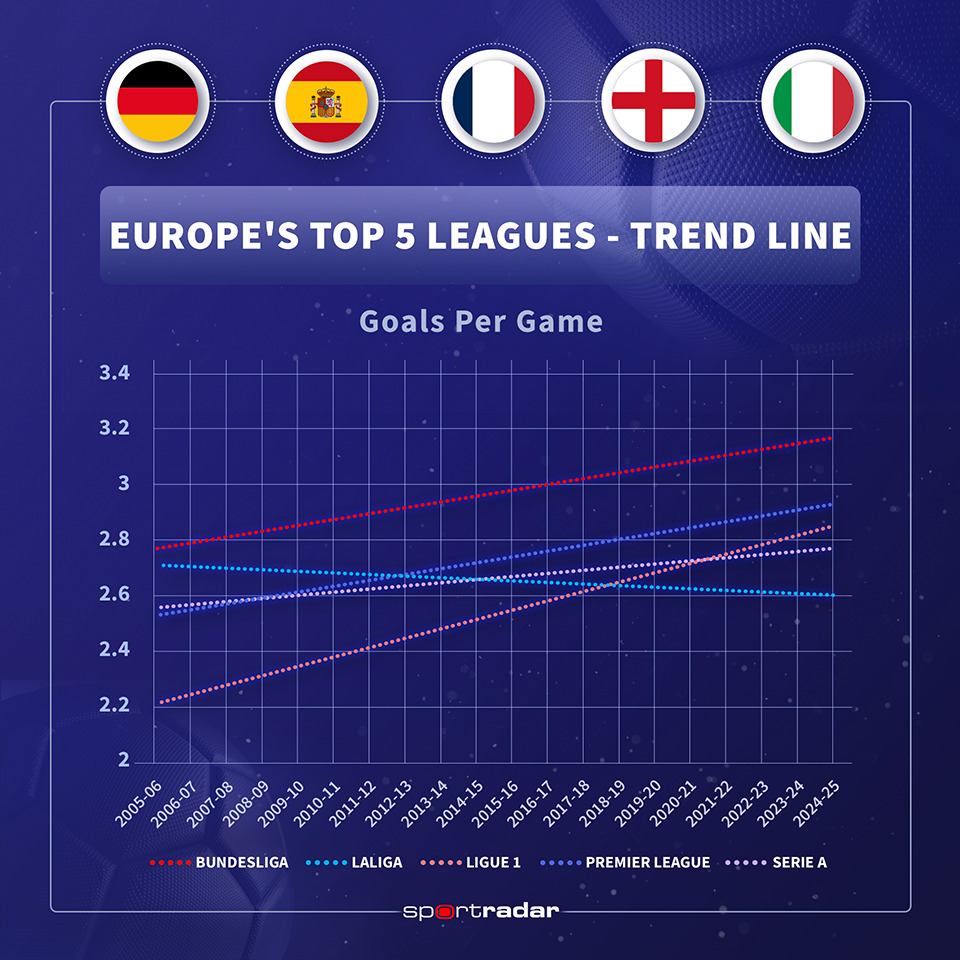
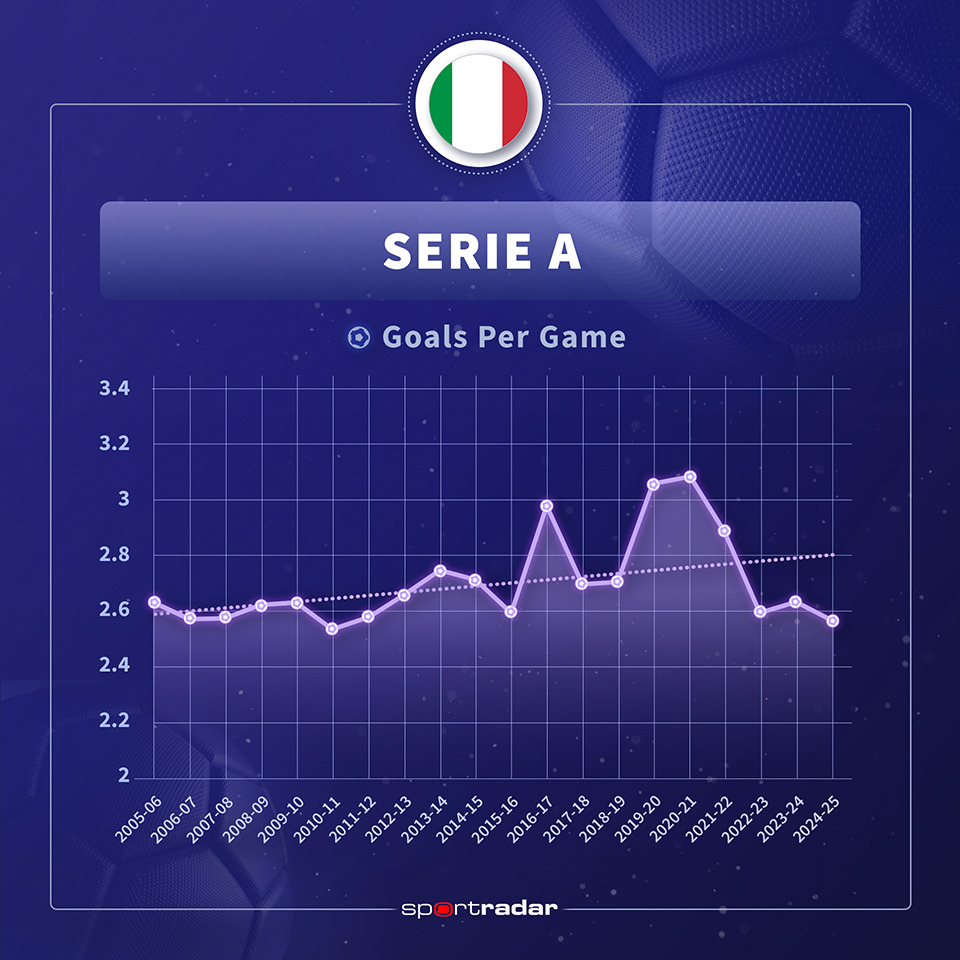
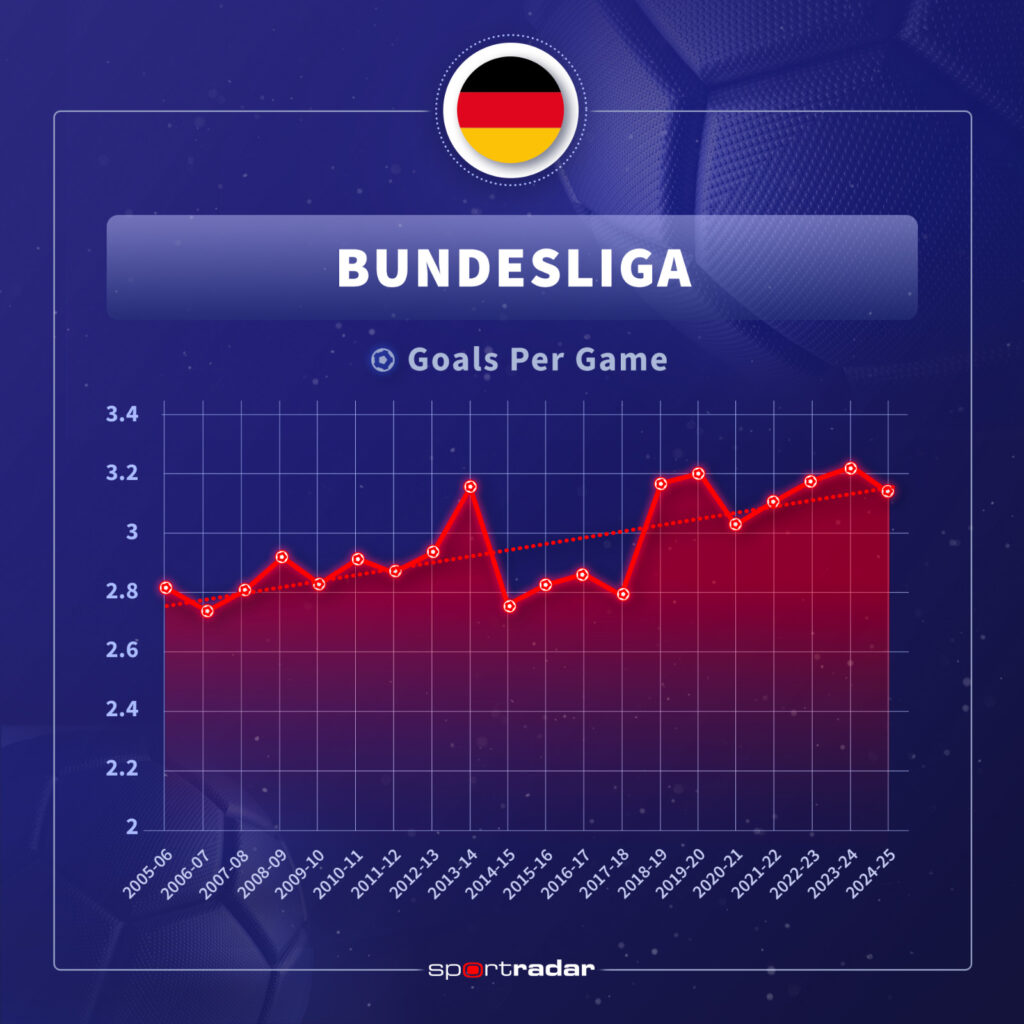
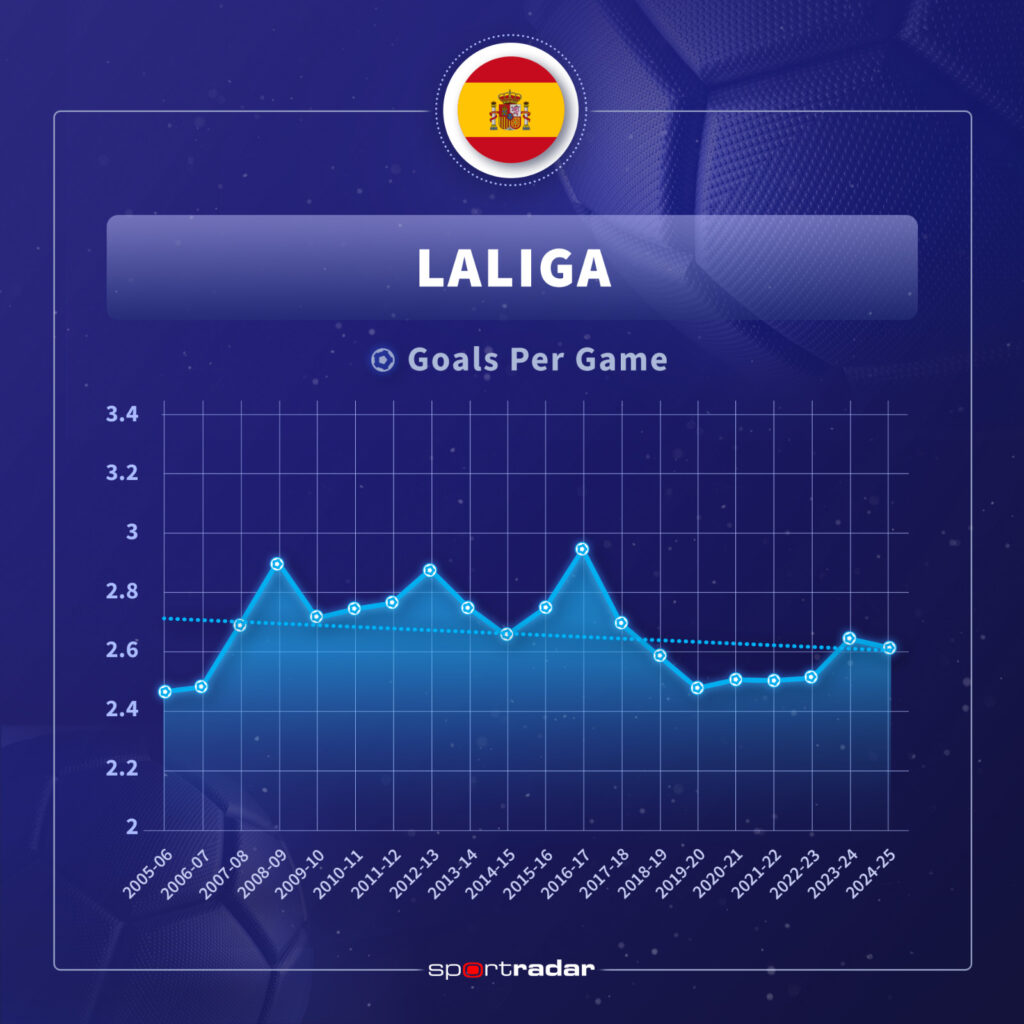
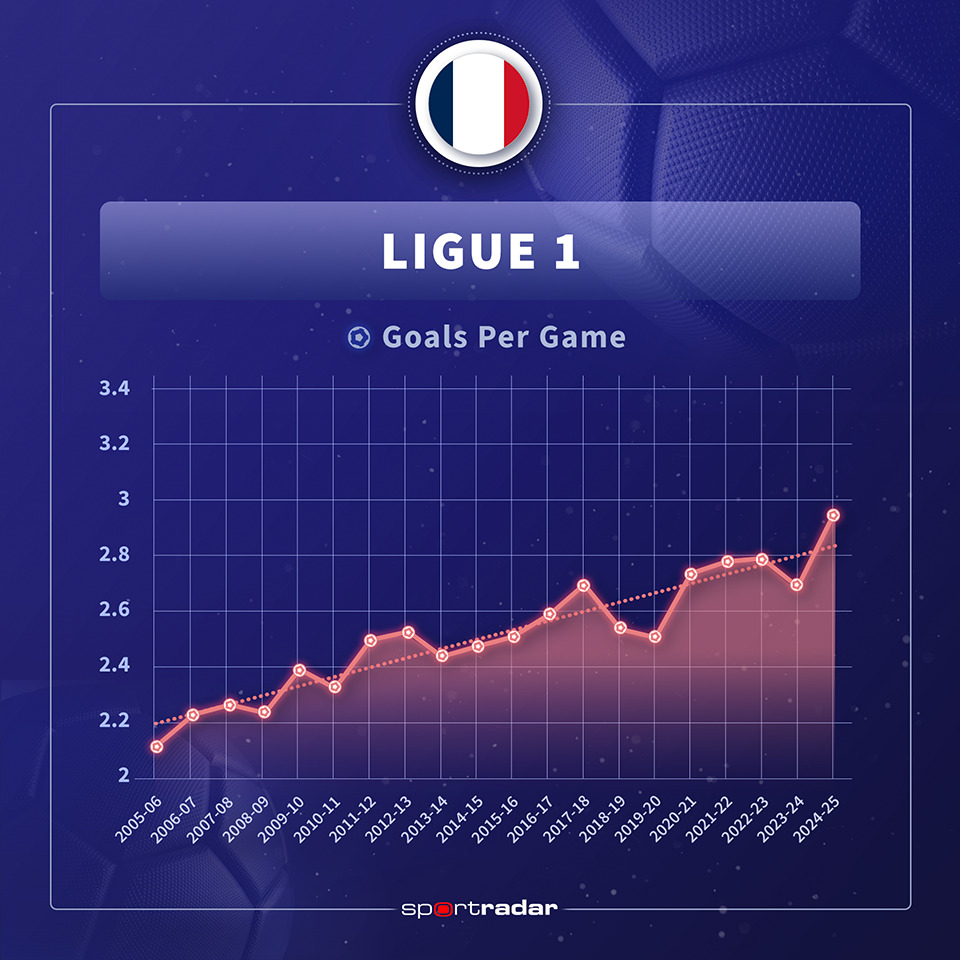
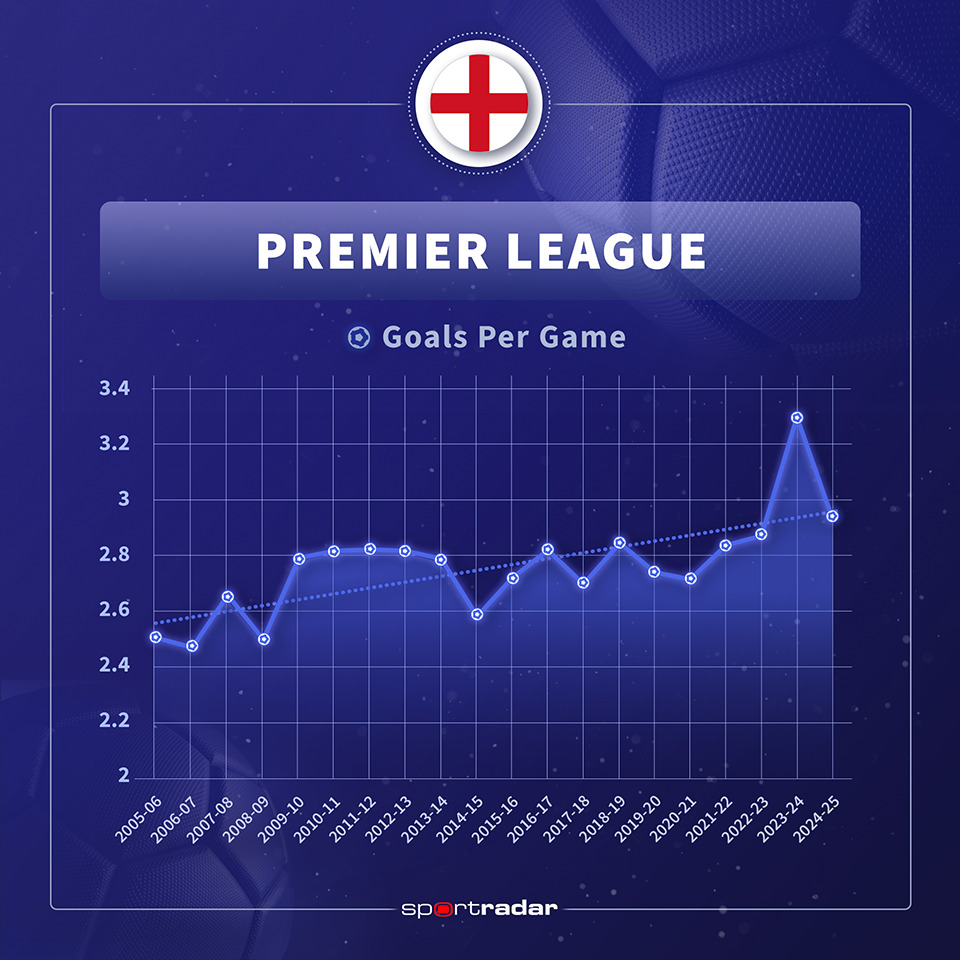
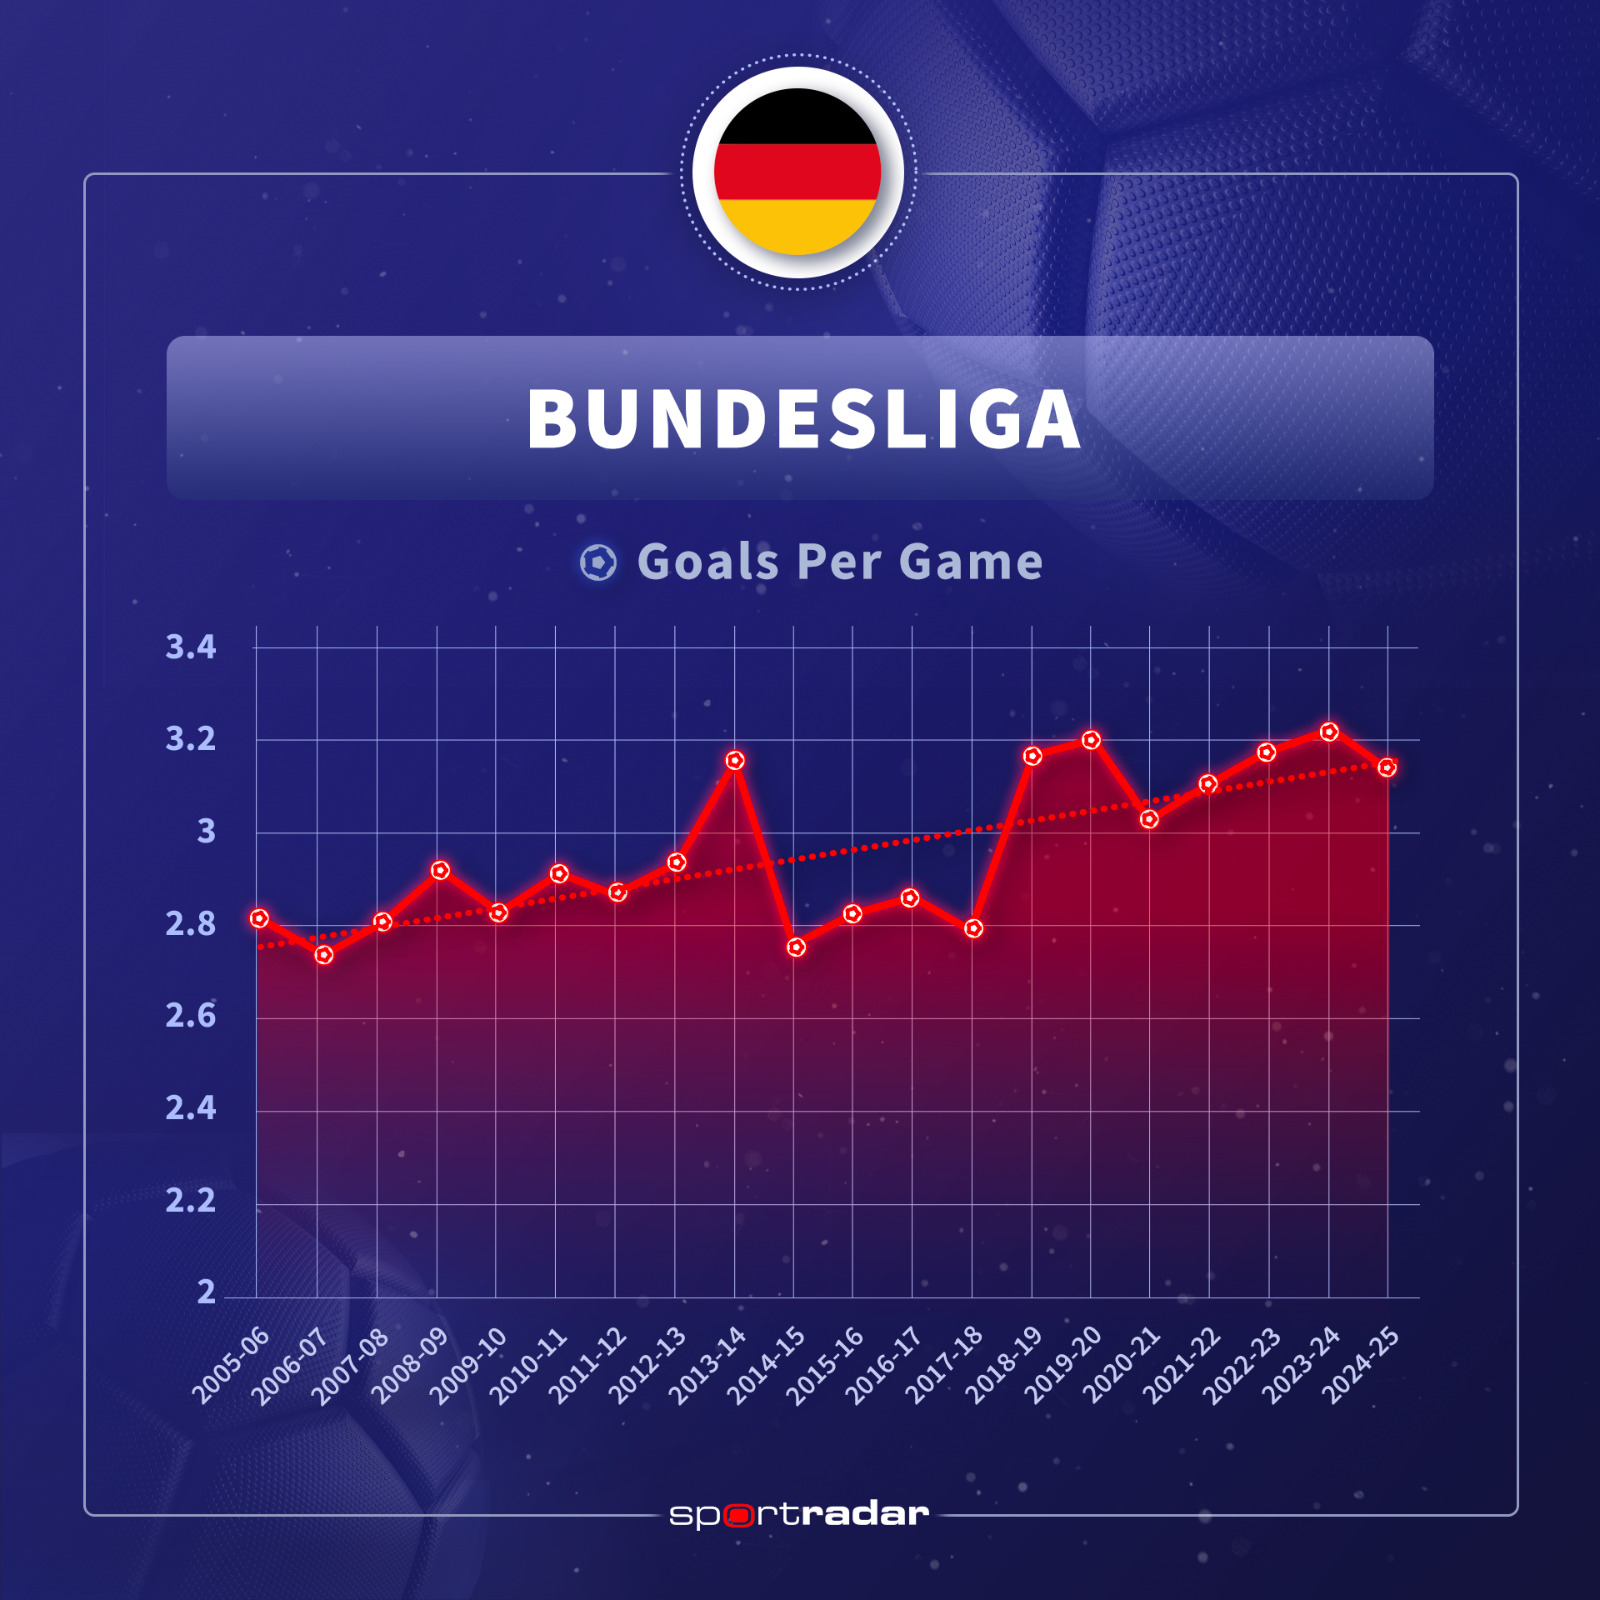
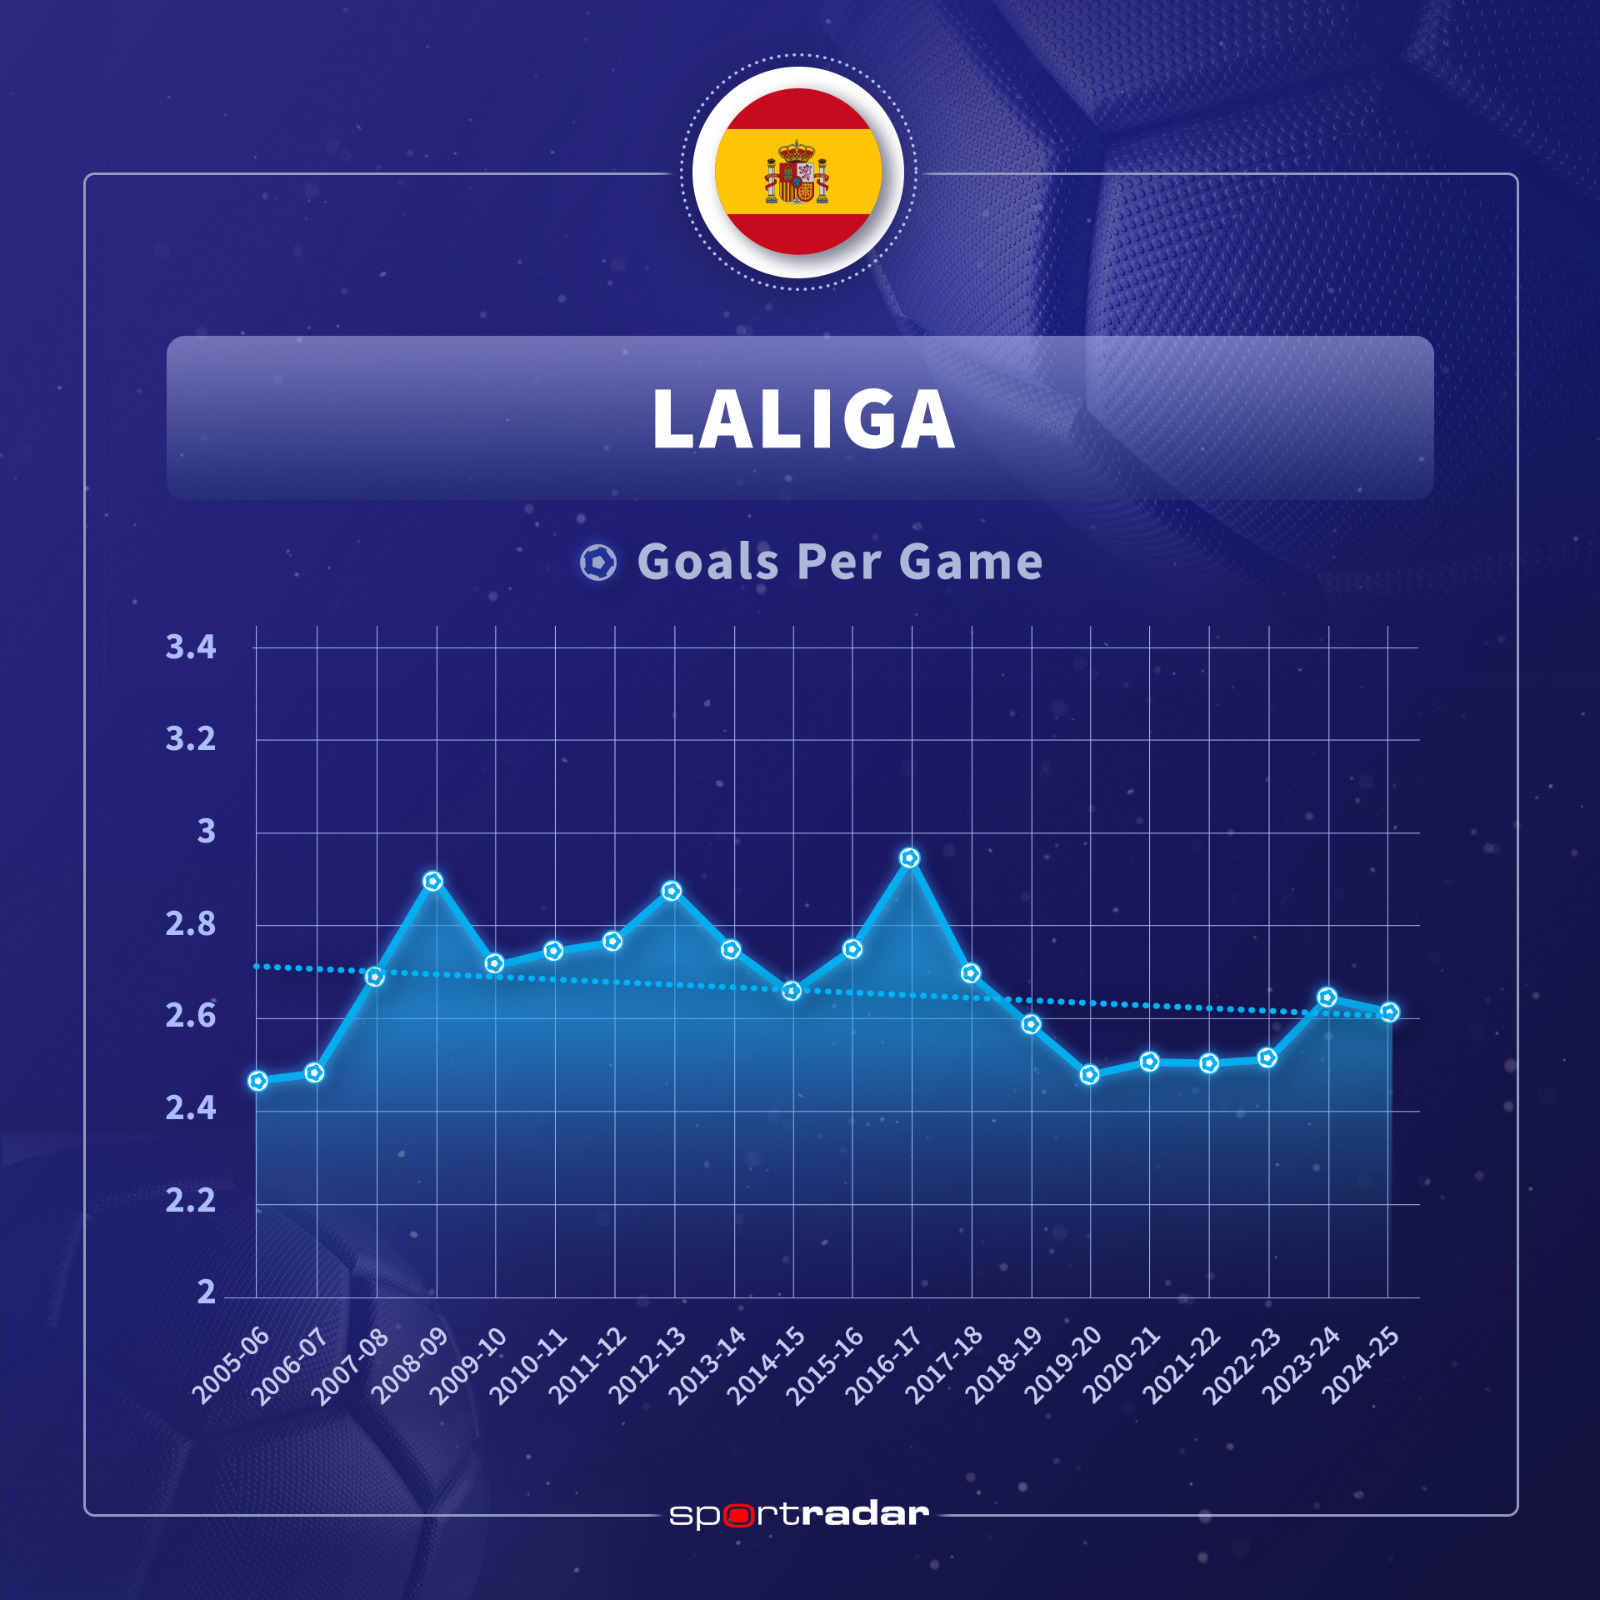
The analysis, which covers 20 seasons or 100 individual campaigns, also raises questions that interest any football fan: which league is becoming more exciting? And in which league have goals been occurring less frequently?
Other highlights:
⇒ Ligue 1 has established itself as one of the most exciting competitions in Europe, with the average number of goals per game increasing from 2,13 (in 2005/06) to 2,96 (in 2024/25).
⇒ La Liga has seen a decline in the number of goals. In 2005/06, the average was 2,46 goals per game, similar to the Premier League. The average increased in the following decade, reaching a peak of 2,94 goals per game in 2016/17 — a peak season for names like Lionel Messi, Luis Suárez, Neymar, and Cristiano Ronaldo. Since then, the average has fallen to 2,62 goals per game in the 2024/25 season.
Additional information
| APPENDIX 1 – DETAILED ANALYSIS:
TOTAL NUMBER OF GAMES ANALYZED: 36.339 |
|
| BUNDESLIGA | 6.154 |
| LA LIGA | 7.600 |
| LIGUE 1 | 7.375 |
| PREMIER LEAGUE | 7.600 |
| SERIES A | 7.600 |
| TOTAL GOALS SCORED: 98.331 | |
| BUNDESLIGA | 18.225 |
| LA LIGA | 20.237 |
| LIGUE 1 | 18.638 |
| PREMIER LEAGUE | 20.845 |
| SERIES A | 20.386 |
| Average goals per game over 20 years: 2.71 | |
| BUNDESLIGA | 2.96 |
| LA LIGA | 2.66 |
| LIGUE 1 | 2.53 |
| PREMIER LEAGUE | 2.74 |
| SERIES A | 2.68 |
APPENDIX 2 – ANALYSIS BY LEAGUE AND SEASON:
Bundesliga – Germany
| Season | Goals per game | Total goals |
| 2005-06 | 2.81 | 861 |
| 2006-07 | 2.74 | 837 |
| 2007-08 | 2.81 | 860 |
| 2008-09 | 2.92 | 899 |
| 2009-10 | 2.82 | 869 |
| 2010-11 | 2.91 | 897 |
| 2011-12 | 2.86 | 882 |
| 2012-13 | 2.94 | 905 |
| 2013-14 | 3.15 | 969 |
| 2014-15 | 2.75 | 848 |
| 2015-16 | 2.82 | 869 |
| 2016-17 | 2.85 | 879 |
| 2017-18 | 2.79 | 860 |
| 2018-19 | 3.17 | 977 |
| 2019-20 | 3.20 | 986 |
| 2020-21 | 3.04 | 935 |
| 2021-22 | 3.11 | 957 |
| 2022-23 | 3.18 | 978 |
| 2023-24 | 3.22 | 991 |
| 2024-25 | 3.14 | 966 |
La Liga – Spain
| Season | Goals per game | Total goals |
| 2005-06 | 2.46 | 936 |
| 2006-07 | 2.48 | 942 |
| 2007-08 | 2.69 | 1021 |
| 2008-09 | 2.90 | 1101 |
| 2009-10 | 2.71 | 1031 |
| 2010-11 | 2.74 | 1042 |
| 2011-12 | 2.76 | 1050 |
| 2012-13 | 2.87 | 1091 |
| 2013-14 | 2.75 | 1045 |
| 2014-15 | 2.66 | 1009 |
| 2015-16 | 2.74 | 1043 |
| 2016-17 | 2.94 | 1118 |
| 2017-18 | 2.69 | 1024 |
| 2018-19 | 2.59 | 983 |
| 2019-20 | 2.48 | 942 |
| 2020-21 | 2.51 | 953 |
| 2021-22 | 2.50 | 951 |
| 2022-23 | 2.51 | 955 |
| 2023-24 | 2.64 | 1005 |
| 2024-25 | 2.62 | 995 |
LIGUE 1 – FRANCE
| Season | Goals per game | Total goals |
| 2005-06 | 2.13 | 811 |
| 2006-07 | 2.25 | 855 |
| 2007-08 | 2.28 | 868 |
| 2008-09 | 2.26 | 858 |
| 2009-10 | 2.41 | 916 |
| 2010-11 | 2.34 | 890 |
| 2011-12 | 2.52 | 956 |
| 2012-13 | 2.54 | 967 |
| 2013-14 | 2.46 | 933 |
| 2014-15 | 2.49 | 947 |
| 2015-16 | 2.53 | 960 |
| 2016-17 | 2.61 | 994 |
| 2017-18 | 2.72 | 1043 |
| 2018-19 | 2.56 | 983 |
| 2019-20 | 2.52 | 704 |
| 2020-21 | 2.76 | 1058 |
| 2021-22 | 2.80 | 1074 |
| 2022-23 | 2.81 | 1067 |
| 2023-24 | 2.71 | 839 |
| 2024-25 | 2.96 | 915 |
PREMIER LEAGUE – ENGLAND
| Season | Goals per game | Goals |
| 2005-06 | 2.48 | 944 |
| 2006-07 | 2.45 | 931 |
| 2007-08 | 2.64 | 1002 |
| 2008-09 | 2.48 | 942 |
| 2009-10 | 2.77 | 1053 |
| 2010-11 | 2.80 | 1063 |
| 2011-12 | 2.81 | 1066 |
| 2012-13 | 2.80 | 1063 |
| 2013-14 | 2.77 | 1052 |
| 2014-15 | 2.57 | 975 |
| 2015-16 | 2.70 | 1026 |
| 2016-17 | 2.80 | 1064 |
| 2017-18 | 2.68 | 1018 |
| 2018-19 | 2.82 | 1072 |
| 2019-20 | 2.72 | 1034 |
| 2020-21 | 2.69 | 1024 |
| 2021-22 | 2.82 | 1071 |
| 2022-23 | 2.86 | 1084 |
| 2023-24 | 3.28 | 1246 |
| 2024-25 | 2.93 | 1115 |
SERIE A – ITALY
| Season | Goals per game | Goals |
| 2005-06 | 2.61 | 991 |
| 2006-07 | 2.55 | 969 |
| 2007-08 | 2.55 | 970 |
| 2008-09 | 2.60 | 988 |
| 2009-10 | 2.61 | 992 |
| 2010-11 | 2.51 | 955 |
| 2011-12 | 2.56 | 972 |
| 2012-13 | 2.64 | 1003 |
| 2013-14 | 2.72 | 1035 |
| 2014-15 | 2.69 | 1024 |
| 2015-16 | 2.58 | 979 |
| 2016-17 | 2.96 | 1123 |
| 2017-18 | 2.68 | 1017 |
| 2018-19 | 2.68 | 1019 |
| 2019-20 | 3.04 | 1154 |
| 2020-21 | 3.06 | 1163 |
| 2021-22 | 2.87 | 1089 |
| 2022-23 | 2.57 | 978 |
| 2023-24 | 2.61 | 992 |
| 2024-25 | 2.56 | 973 |

